


Introduction to Firefox Debugger
Are you only using console.log to debug your JavaScript code? It is OK to admit. Using console.log is easy and convenient, but it has limitations. It isn’t great for catching things as they happen, or diving deep into code to see exactly where it is broken. To do that, you’ll need a full-featured debugger. The Firefox Debugger has comprehensive tools to evaluate and repair broken code. Once you learn the basics, you’ll find that using a debugger is not only fast and easy, but it can save you from hours of frustration, and potential ‘bang-head-on-desk’ sessions.
We’ll learn the basics of Firefox Debugger by debugging a simple to-do app. You will need Firefox to follow along. Don’t have Firefox? Check out Firefox Developer Edition.
Before diving in, let’s take a look at the Debugger interface. Hit option + command + S on Mac or shift + ctrl + S on Windows to open the Debugger.
The Debugger is divided into three panes:
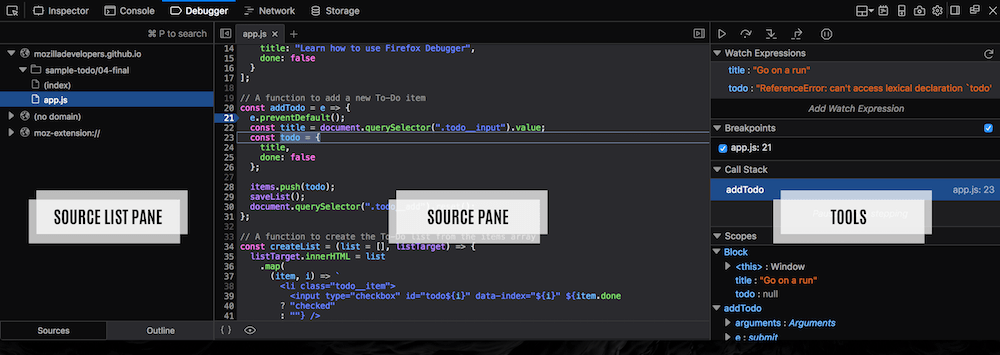 An overview of the Firefox Debugger Panel
- The source list pane shows all the JavaScript files related to the current page or project.
- The source pane shows the content of those files.
- The tool pane contains info and tools.
The tool pane can be broken down into five sections:
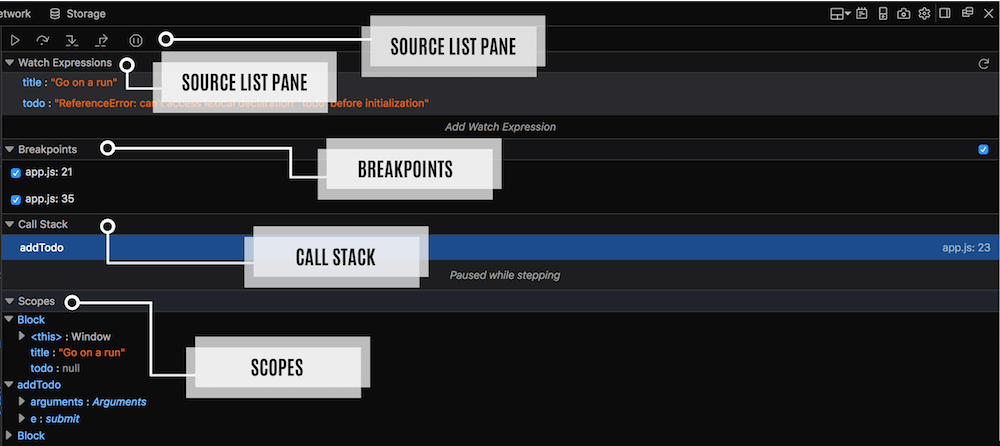 All of the tools available in the tools pane
- The toolbar has buttons that control the debugger’s movement through the script.
- The watch expressions section allows us to watch expressions as executions are paused.
- The breakpoints section displays all of the breakpoints that have been set. Next to each breakpoint is a checkbox to enable or disable that breakpoint.
- The call stack section displays each level of the call stack, as well as the function name, filename, and line number.
- The scopes section displays all objects that are in scope.
Don’t worry if you don’t understand what all of these terms and symbols mean. We’ll cover them in the following sections. Just take note of where things are so that you can follow along.
Now that we’ve reviewed the Debugger interface, let’s use it to fix a broken to-do app.
