Conditional Breakpoints
Breakpoints are a powerful tool for debugging JavaScript code, but what if we have a breakpoint inside a loop, or a function that is constantly being called? It can become tedious to have to constantly be resuming the execution of our code. It would be much better if we could control when a breakpoint is triggered. Lucky for us, Firefox DevTools has a useful feature called conditional breakpoints.
A conditional breakpoint allows us to associate a condition with a breakpoint. When the program reaches a conditional breakpoint, the debugger pauses only if the condition provided evaluates to true.
The best way to understand this, is with an example. Open up the to-do app below in a new tab and follow along.
In the first tutorial, we added a breakpoint inside the addTodo function. This breakpoint can be useful, but it will trigger every single time we add a to-do item.
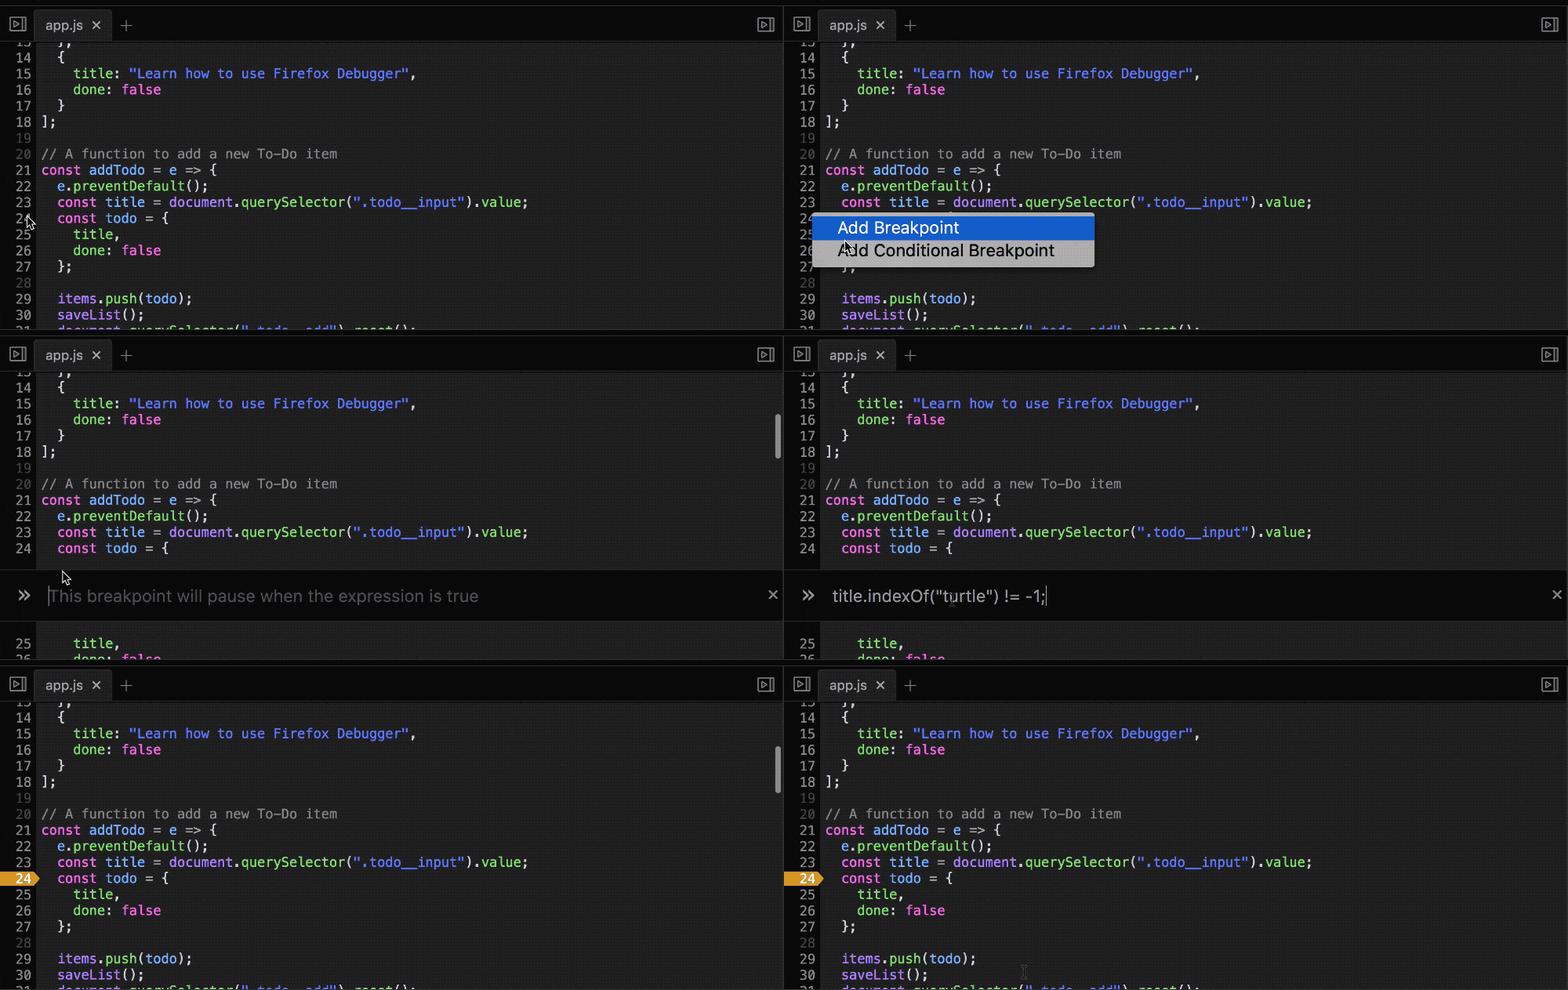
Let’s say we only want to trigger this breakpoint when the to-do item contains the word “turtle”. We can do this by right clicking on the line number we want to add a breakpoint to (in this case, line 24), and choosing “Add Conditional Breakpoint” from the menu.
 Creating a conditional breakpoint
We can now enter an expression. Try the following:
title.indexOf("turtle") != -1;
The indexOf() method will return -1 if the specified value (in this case, “turtle”) is not found. This means the expression provided to our conditional breakpoint will only evaluate to true if the string contains the word “turtle”.
We can use any type of expression for a conditional breakpoint. We can even use console.log. A console.log expression will return undefined so it won’t pause execution, but it will still print to the console. Let’s try it out.
Add a conditional breakpoint on line 68, right after we define the index variable. Enter the following as the condition:
console.log(items[index].title);
Now, every time we delete an item, the name of that item will be printed to the console. We get all of the benefits of using console.log, but we don’t have to worry about littering our code with lines that we will need to eventually delete.
