The Call Stack
Now let’s add some functionality to our todo app. In this example we’ve added the ability to delete a task. Open the app in a new tab to follow along:
Try adding a few tasks. Now try deleting the first task. It seems to be working. Now try deleting the final task. Uh-Oh. Something is not quite right. The top task is deleted from the app every time, regardless of which task we try to delete.
Let’s dive into Debugger to see what’s going on in the code. Locate the removeSinglefunction on Line 39 of app.js. This is the function that handles the removal of a task. Insert a breakpoint on line 40, which will trigger right after an item is deleted. Try to delete the last item in our to-do list to trigger this breakpoint. Now we can step through the code to find the root of our problem.
In the previous section, we learned how to use the ‘Step Over’ button to step across lines of JavaScript code. We can use the 'Step Over’ button here, but when we reach the spliceItem function, it will execute the function and then move on to the next line. This is great, but what if the problem exists inside that spliceItem function? This is where we can use the ‘Step In’ button.
 The 'step in' button in the toolbar
The ‘Step In’ button is similar to the ‘Step Over’ Button, but it will allow us to step into a function for debugging, instead of executing it and moving on. Let’s use the ‘Step In’ button until we find ourselves on line 24, inside the createList function. Don’t worry if you are a bit confused about what is happening. It will all start to make sense.
The createList function receives an object called list, and uses that object to create an updated to-do list. If we hover over the list object, we can see the list of to-do items that was provided to this function. We can also see that the item we intended to delete is still there, which means that this function was provided the wrong information. The bug is not in this function, but rather somewhere in the code before this function was invoked.
On the right side of the Firefox Debugger, there is a section called Call Stack. This section provides us with information about which functions we have stepped into, what lines those function are on, and how deep we are in the call stack. If you are following along, you will see that there are four items in the call stack. We started at the spliceItem function, which invoked the saveList function, which invoked the createList function.
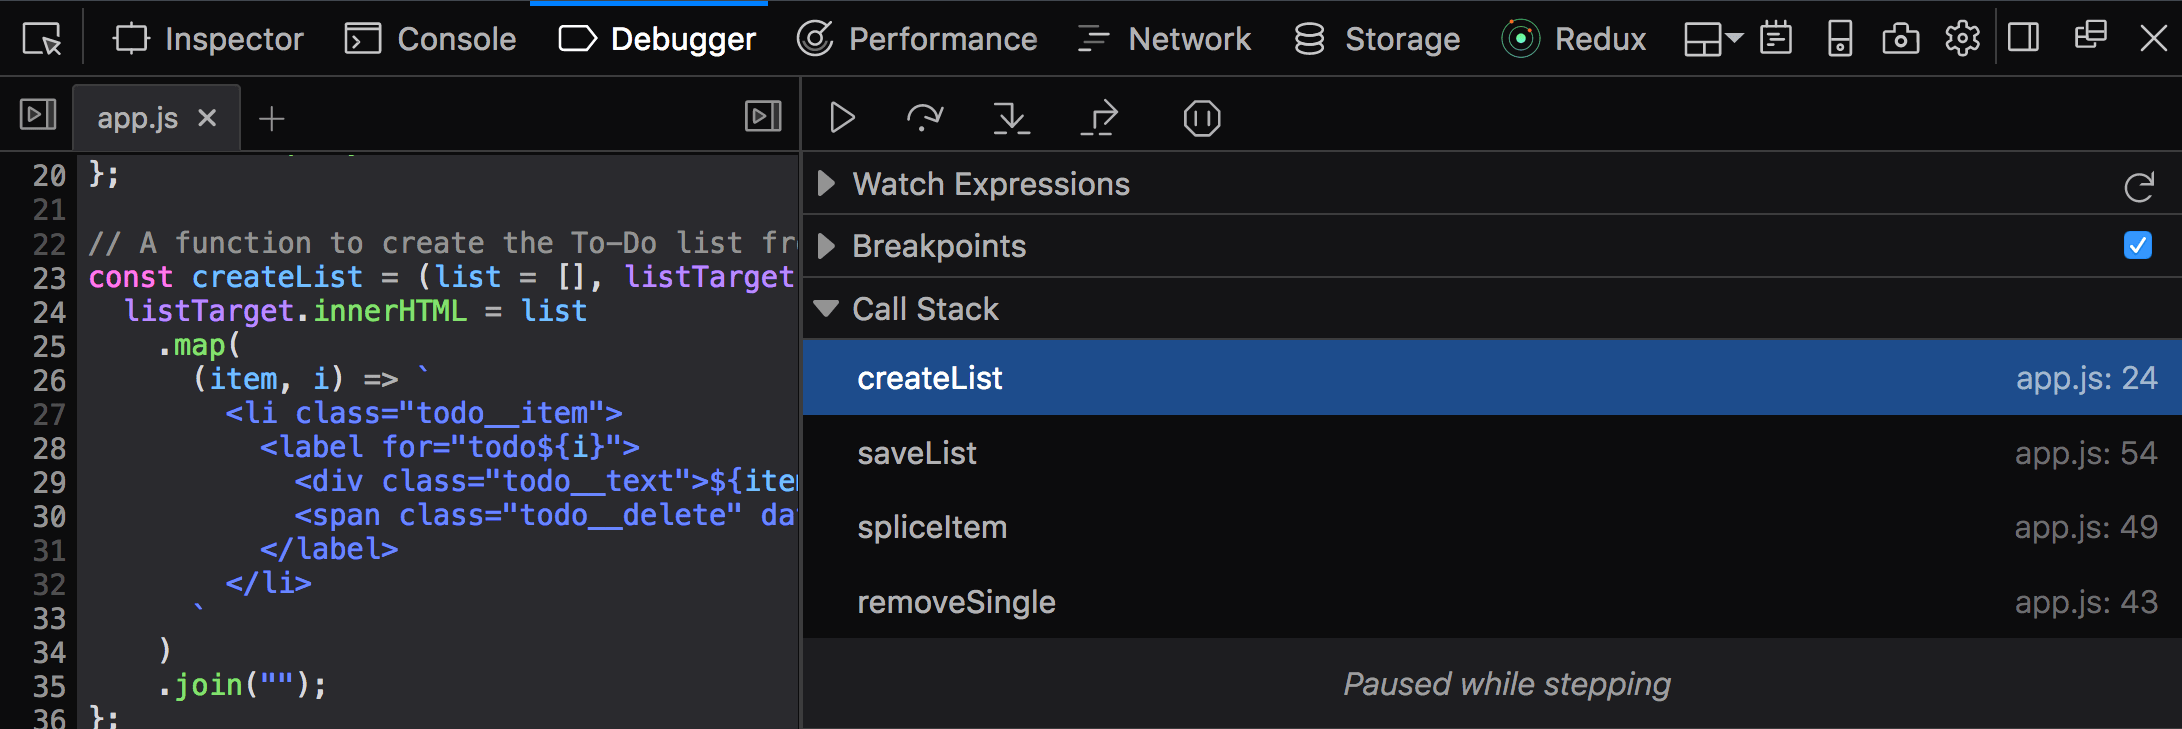 The call stack
The Call Stack section allows us to move back through the call stack so that we can figure out where this problem started. If we click on saveList in the call stack section, we can see that it is a simple (and probably unnecessary) function that takes the global items object and passes it to the createList function. The bug can’t be here so let’s click on the spliceItem function in the call stack. Do you spot the issue here? The index argument is undefined! Now we are getting somewhere.
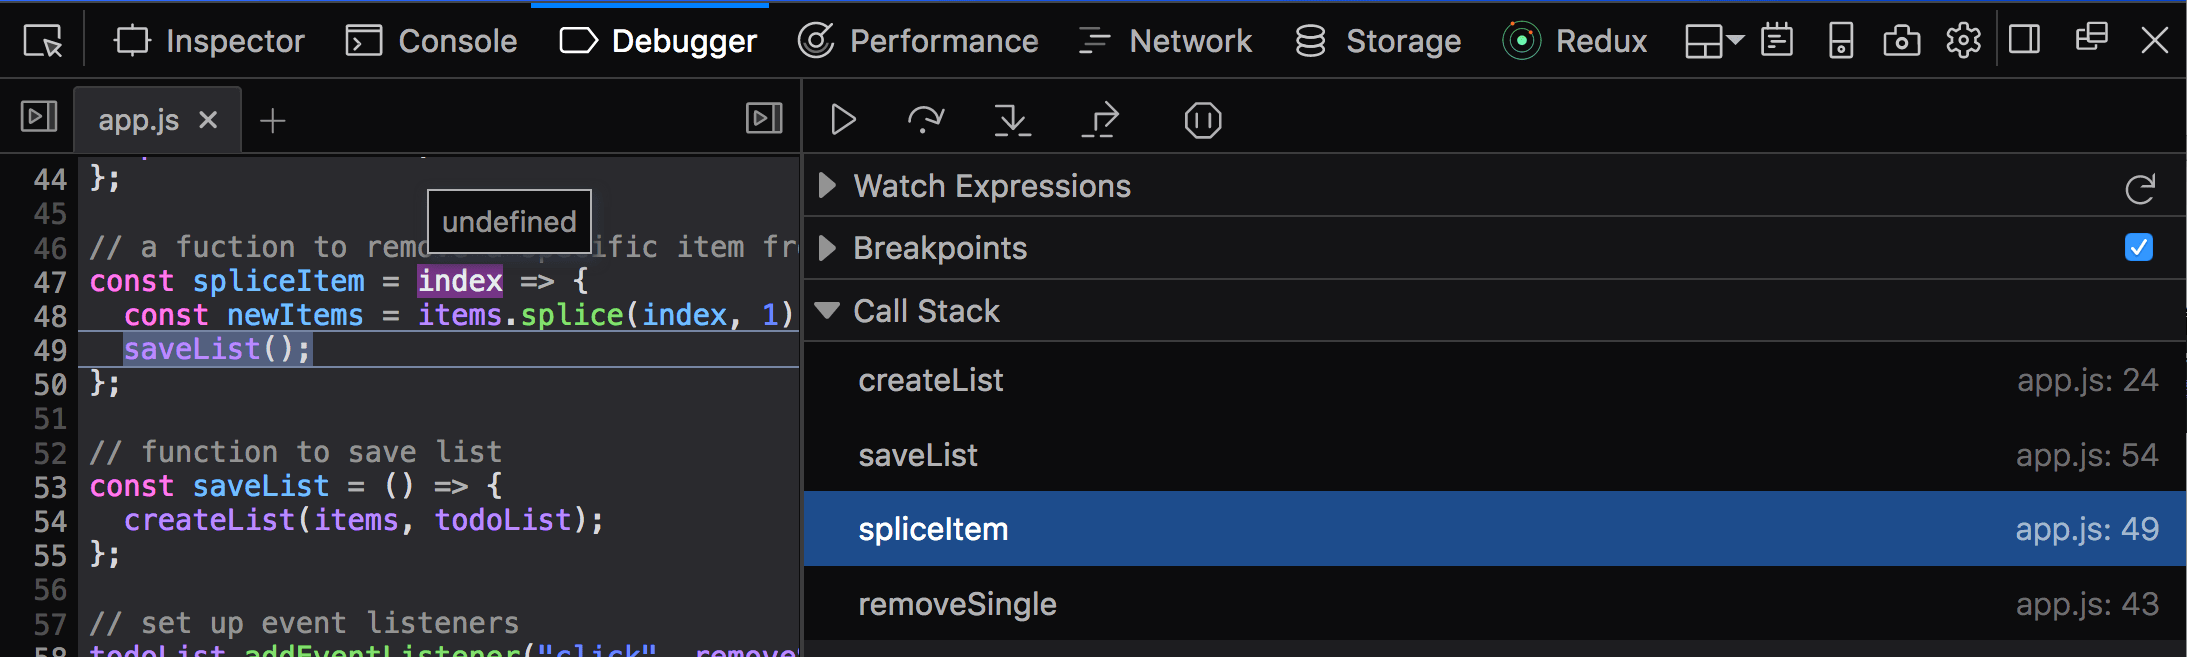 Spotting a bug by moving through the call stack
Let’s continue through the call stack to the removeSingle function. Look at the following:
const index = el.dataset.number;
If we hover over index (or number), we see that it is undefined. If we hover over dataset we’ll see that there is no number property. There is only index. A typo! The line should say:
const index = el.dataset.index;
Once this is fixed, everything starts working.