Find the Value of a Variable
A good first step towards moving away from console.log is to tackle one of its primary use cases: finding the value of a variable.
Let’s take a look at a simple to-do app:
This app has a function called addTodo which will take the value of the input form, create an object, and then push that object onto an array of tasks. Let’s test it out by adding a new task. You’d expect to have this new task added to the list, but instead you see "[object HTMLInputElement]".
Something is broken, and we need to debug the code. The temptation is to start adding console.log throughout the function, to pinpoint where the problem is. This approach might look something like this:
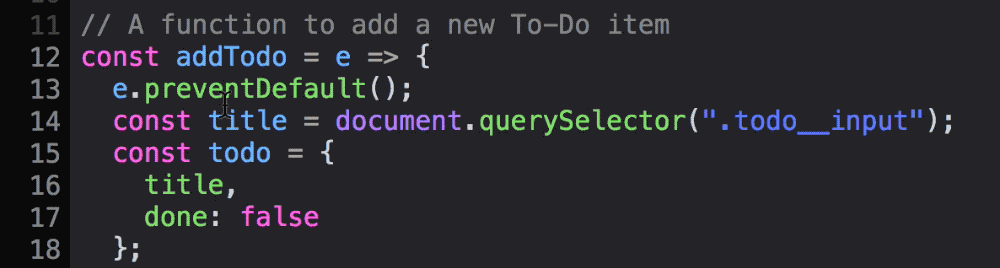
const addTodo = e => {
  e.preventDefault();
  const title = document.querySelector(".todo__input");
  console.log('title is: ', title);
  const todo = { title };
  console.log('todo is: ', todo');

  items.push(todo);
  saveList();
  console.log(‘The updated to-do list is: ‘, items);
  document.querySelector(".todo__add").reset();
};
This can work, but it is cumbersome and awkward. We also have to remember to remove these lines after fixing the code. There’s a much better way to do it with Debugger using what is called a breakpoint.
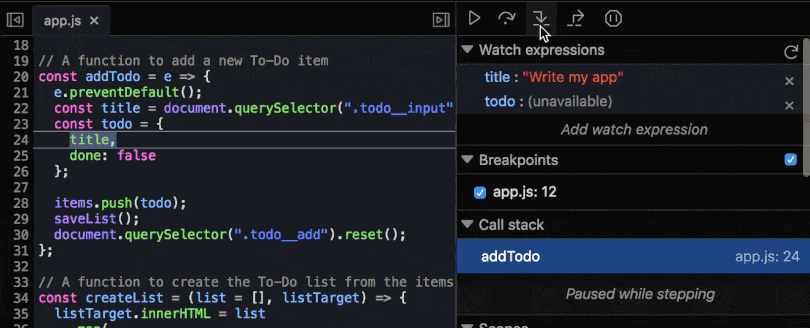
A breakpoint is something that signals to Debugger that we wish to pause execution at a specific place in the code. While paused, we can view the value of a variable at that particular point in the code. Using the example linked above, let’s add a breakpoint to line 13. We can do this by clicking on the number 13 to the left of the code. If done correctly, a little blue flag will appear.
 Adding a breakpoint
Now try adding a task. Because of the breakpoint, execution of the code will pause inside theaddTodo function, just before line 13 is executed. We want to track the value of the title and todo variables to see why the value of the input form isn’t being used when rendering the to-do list. There are a few ways we can check the value of a variable.
Method 1: Use the console
When we hit a breakpoint, and pause execution, we can use the console within the scope of where the code was paused. This means we can type title into the console, hit enter, and view the value of that variable.
Method 2: Hover
We can also hover over the variable in the source pane to view the value of that variable. Try hovering over other items such as an object or a function. Hovering provides us with quick access to all sorts of information that can be helpful for debugging.
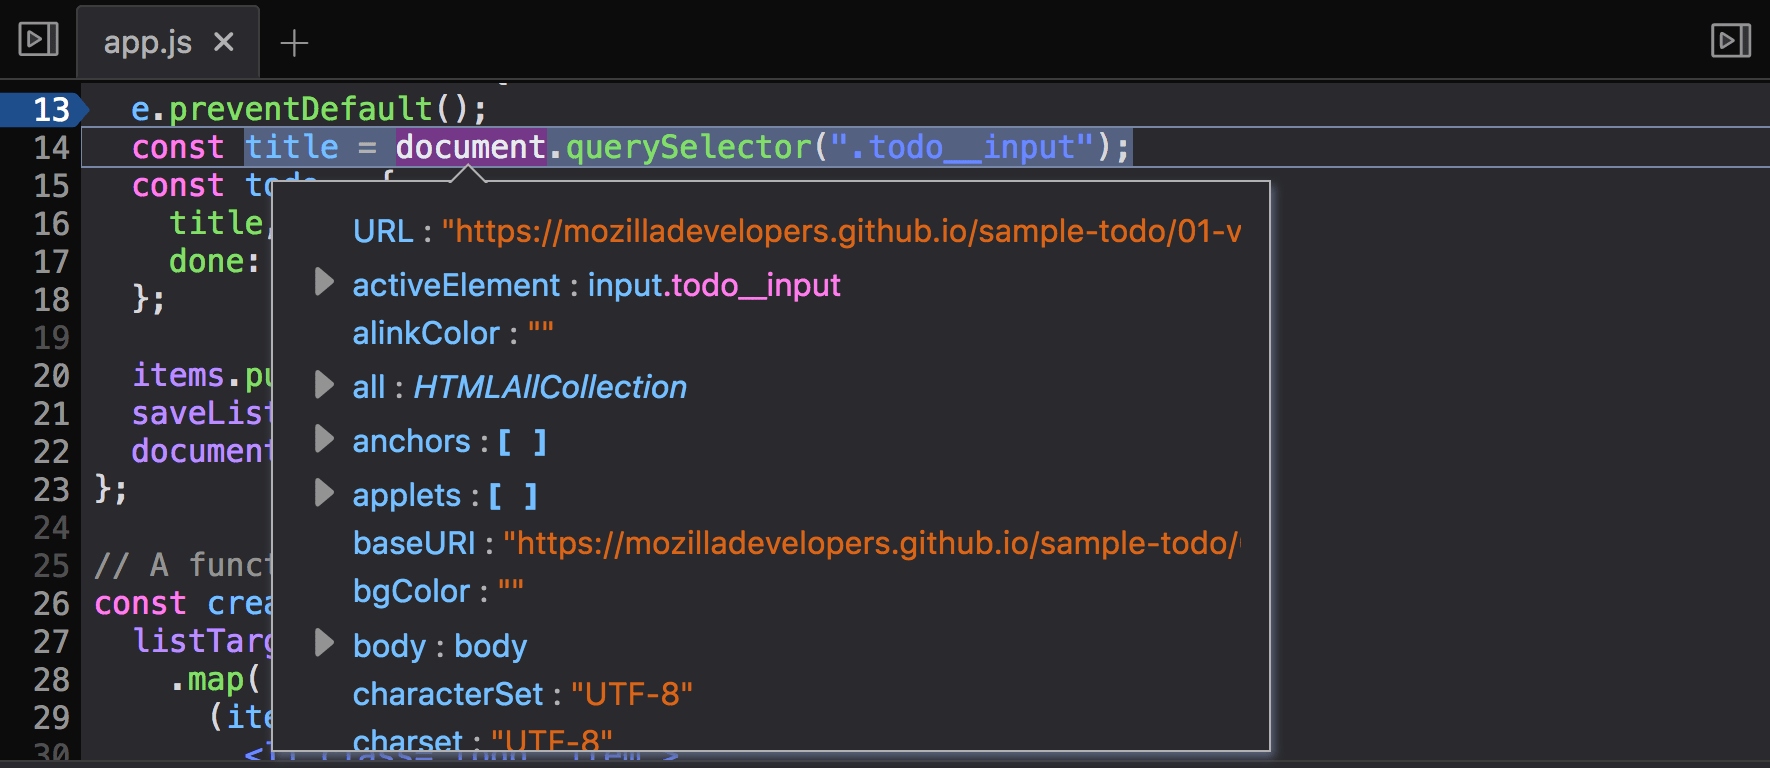 Hovering for information
Method 3: Scope Section
At the bottom right of the Firefox Debugger is a section that displays all objects that are in scope at this point in the program. The first block will list variables in the current block/function and their values.
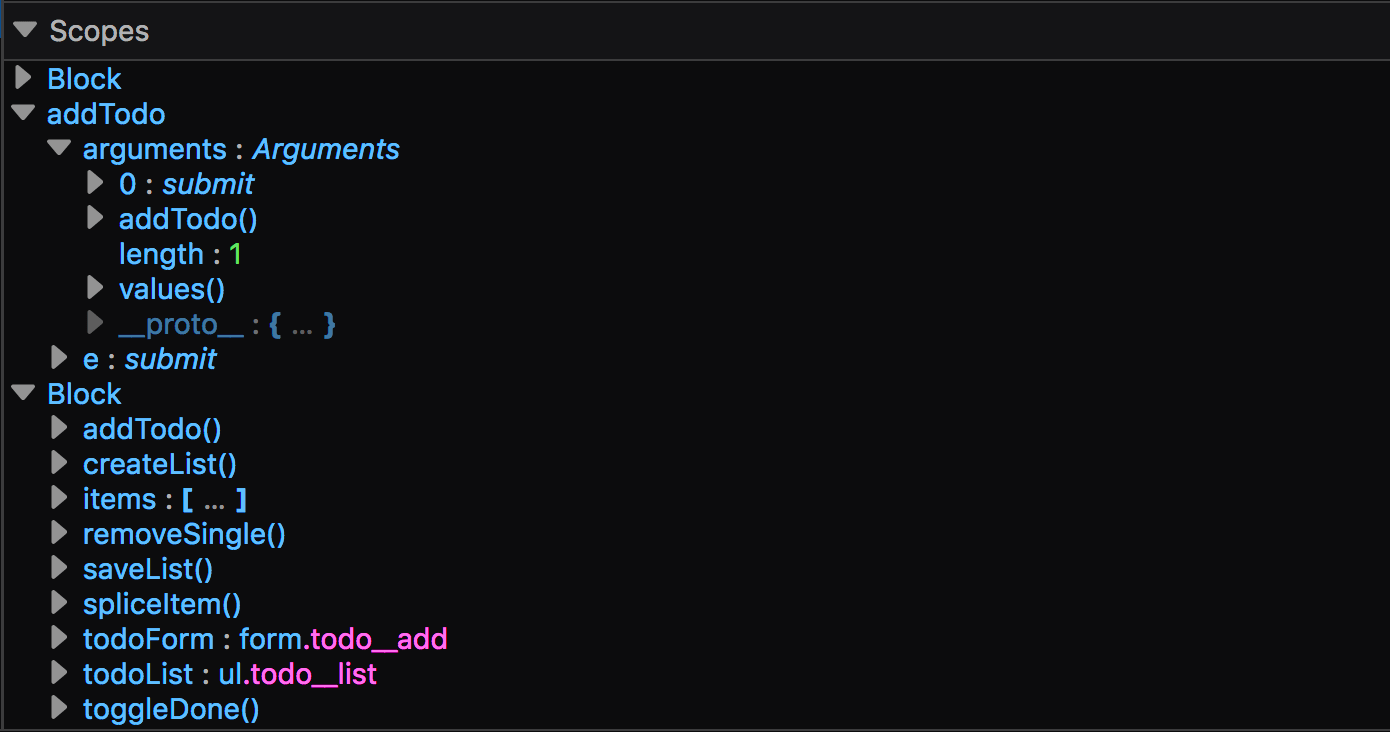 The scopes section in the Firefox Debugger
If you tried any of those methods while paused at line 13, you may have noticed a little problem: the title and todo variables are undefined. This is because execution has paused just before line 13, and the lines that would assign a value to those variables haven’t been executed yet. We need to continue to move through the script until those variables are assigned a value. This is where the toolbar comes in.
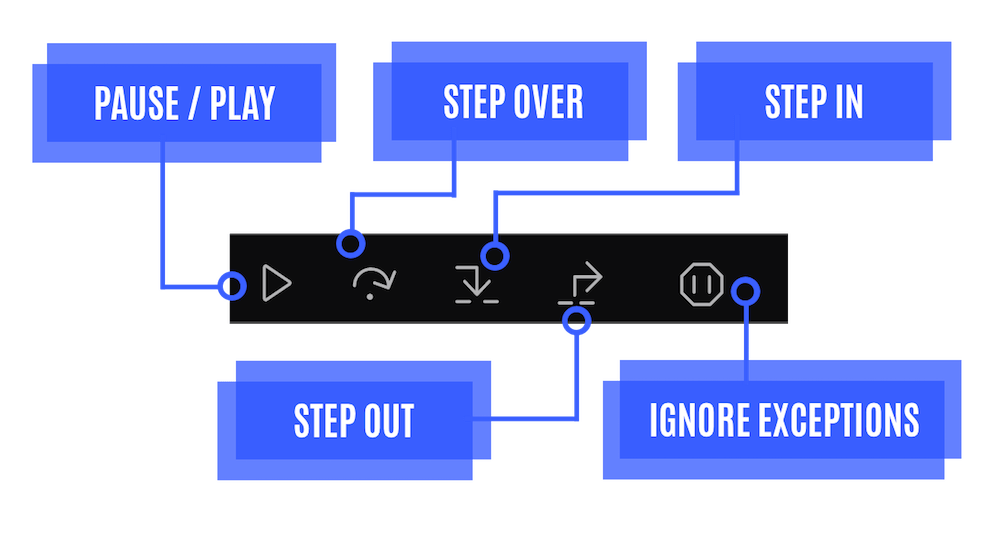 The Firefox Debugger toolbar
Here is what the toolbar buttons do:
- Play/Pause
- Pauses or resumes execution of the script we are debugging. When it displays a "play" icon, that means the script is paused, either because we’ve paused it with this button or because we’ve hit a breakpoint.
- Step over
- Steps across the current line of JavaScript code.
- Step in
- Steps into the function call on the current line of JavaScript code.
- Step out
- Runs the script until the current function exits.
Right now, we are going to focus on the ‘Step Over’ button. This will step through the code one line at a time. If it comes across a function, it will execute the entire function. This is different from the ‘Step In’ button which will enter into that function instead of executing it. Don’t worry about understanding the difference just yet. We’ll cover ‘Step In’ more in the next section.
Press the ‘Step Over’ button once. The code is still paused, but line 14 is now highlighted. This means line 13 has executed. The
title to get the value. We can also check the scope section. 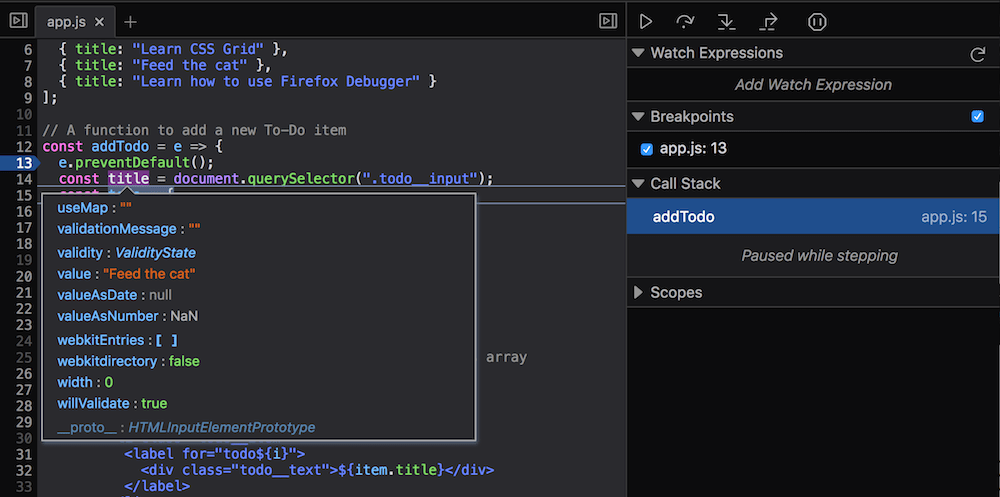 Hovering over 'title' to see its value
If we use one of the three methods to look at the value of title, we can spot our issue. The value isn’t a string like we’d expect, but rather it is an entire object! If we hover over title and scroll through its different properties, we’ll find that we should have referenced the ‘value’ property of the object instead of the entire object itself. Fix line 14 and the app will work properly.
When we are done stepping through the code, we can press the 'Play/Pause' button which will resume execution of the script (until it hits another breakpoint).
Phew. That was a lot of information. Try adding some other breakpoints in the app, and using the toolbar to step through the code. As you get comfortable with the basics of breakpoints and stepping through code, you will start to understand how powerful Debugger is.
When you are ready, move on to the next section of the tutorial to learn more about how we can use Firefox Debugger to debug our code.